![]()
Commercial wireless versus standard stationary EEG systems for personalized emotional brain-computer interfaces: a preliminary reliability check
Derrick Matthew Buchanan 1,2, Jeremy Grant 1,2 and Amedeo D'Angiulli 1,2,*
1 Neuroscience of Imagination Cognition Emotion Research Laboratory, Ontario, Canada.
2 Department of Neuroscience, Carleton University, Ontario, Canada.
* Correspondence: amedeo.dangiulli@carleton.ca; Tel.: +1-613-520-2600 x 2954
Received: 15 November 2018; Accepted: 5 March 2019; Published: 11 March 2019
Edited by: King-Hwa Ling (Universiti Putra Malaysia, Malaysia)
Reviewed by: Bingzhe Xu (Harvard Medical School, Boston, USA); Norshariza Nordin (Universiti Putra Malaysia); Dania Cheaha (Prince of Songkla University, Thailand)
https://doi.org/10.31117/neuroscirn.v2n1.21
Abstract: We present a preliminary data-based assessment of measurement reliability of the commercial 14-electrode Emotiv EPOCTM EEG wireless system in distinguishing between electrophysiological states of emotional function, as compared to a standard research-lab stationary 32-electrode EEG system for personalized single-individual use. Individual observers completed two tasks designed to elicit neural changes in emotional arousal and valence while simultaneously recording their EEGs with both systems in separate sessions. Participants observed emotion-laden words from the ANEW database and images from the IAPS database, both widely used and validated databases for emotional processes in multidisciplinary research. The pattern of results distinguished between high and low arousal and valence states using the stationary traditional system, but not the commercial device. Also, the latter device recorded EEG band frequencies at a much lower resolution and frequency range than the standard system. These findings suggest poor validity when using the commercial device and therefore should be cautioned against in a research setting.
Keywords: arousal; valence; brain-computer Interfaces; EEG; wireless;
©2019 by Buchanan et al. for use and distribution in accord with the Creative Commons Attribution (CC BY-NC 4.0) license (https://creativecommons.org/licenses/by-nc/4.0/), which permits unrestricted non-commercial use, distribution, and reproduction in any medium, provided the original author and source are credited.
1. INTRODUCTION
The identification and classification of human emotions using electroencephalography (EEG) is a major research focus for developing Brain-Computer Interface (BCI) devices. Translating electrophysiological signals from a person's scalp into quantifiable data (event-related potentials, or ERPs) is useful for programming computer systems to recognize emotional content in facial expressions and vocal inflections [1] and allows software-based intelligence systems to adapt their function to a user's overall emotional state in real-time [2]. The need for cost-effective EEG systems that can reliably distinguish between emotional states is growing in importance; EEG systems with a greater number of electrodes enable researchers to provide higher resolution recordings of electrophysiological activity but also require a lengthy preparation time to arrange the electrodes and test the signal amplification. Public and private businesses seeking to employ BCI devices to enhance their operatives' functionality are often interested in EEG systems with fewer electrodes-minimizing preparation time while potentially sacrificing the quality and resolution of the electrophysiological signal recordings. Recent reports have demonstrated that there is indeed some research utility for consumer-grade devices such as the Epoc as compared to other similar devices such as the Neurosky MindWave [3]. However both of these devices' performance is questionable compared to proper research-grade EEG [4].
The push to incorporate classification algorithms within these devices is prominently associated with the alluring promise of personalization, single-individualized use according to which the BCI system might be calibrated and fine-tuned to the individual characteristics of the person's brain/mind (which assumes an "N=1" approach). Our current investigation provides novel evidence against relying on consumer devices for research grade tasks, specifically in this case for measuring neuropsychological aspects of emotional states (stimulus valence and arousal). Most current research with consumer-grade devices is limited since it uses only the consumer device itself; failing to demonstrate validity and reproducibility of results by comparison with a juxtaposed research grade device. We overcome this limitation by directly comparing the data acquired from a consumer grade EEG to that of a research grade EEG under the same conditions using a within-subject design.
We
acquired two adjacent EEG systems for their potential application as a part of
a brain-computer interface: the Brain Vision Easy
Cap EC40 headset and the actiCHamp active
channel amplifier system (henceforth Brain Vision of BV) as well as the Emotiv EPOCTM EEG wireless system
(henceforth abbreviated simply as Epoc). The Brain
Vision Easy Cap is a standard research grade 32-electrode headset, whereas the Epoc headset is a consumer grade device with only 14 electrodes, but boasts a much more elegant user-friendly
design. In addition, it transmits electrophysiological data wirelessly via a BluetoothTM transmitter, bypassing the
signal processing traditionally performed by an external amplifier. While
preparation time is minimal (10-15 min on average, as compared to 45-60 minutes
for BV), the Epoc headset does not have any
electrodes placed along the midline of the head, and it uses two reference
electrodes on both sides of the head corresponding with the parietal lobe (P3
and P4) as opposed to using a single ground electrode along the midline as
reference in traditional EEG systems. Furthermore, the electrodes are placed on
the scalp without any gel substance serving as an intermediate for electrical
conduction, thereby further limiting the ability to perform EEG source analysis
(approximating the anatomical source of temporal electrical activity). For this
reason, a viable test of comparative measurement reliability with other systems
can be done through measurement of global or whole electrical brain activity.
This is the approach we took in this preliminary study.
In this study, we evaluated the Brain Vision Easy Cap EC40 and the Epoc EEG systems on their efficacy and reliability in differentiating between varying levels of two distinct dimensions of emotion, emotional arousal and valence [4]. We presented human subjects with two experimental tasks designed to examine if the Brain Vision system could be used to distinguish between states of high and low arousal and high and low valence, based on patterns of event-related frequency band potentials (ERBPs) in response to the presentation of emotionally-salient words or visual stimuli. Importantly, we report novel findings regarding the comparable signal quality of each device and the inability of Epoc to reproduce the results seen using the BV device.
2. MATERIALS AND METHODS
2.1 Participants
Participants were three healthy graduate and undergraduate students (mean age 24.66 years old) serving as trained research assistants. This study followed all ethical guidelines on human participant set out by the host institution. All participants were right-handed males with corrected-to-normal (N=2) or normal (N=1) vision, and none reported any history of neurological impairment or were currently using psychoactive medications. The average number of hours of sleep on the previous night was 7.5 hours. Testing was conducted from 10 a.m. to 4 p.m. with a one-hour break in between on two separate days. The pre-experimental short adult version of the mood and feelings questionnaire [5] were administered by an independent research assistant unaware of the hypotheses and goals of the study to screen mood differences or emotional changes before the experimental sessions between days. No remarkable differences were reported as all participants scored similarly (overall score range: 3-5) in the two days and consistently well below the recommended clinical cut-off (possible maximum = 26; clinical cut-off = 11).
2.2 Experimental design
The
participants completed two tasks sitting in front of a computer monitor while
undergoing ERP analysis using the 32-electrode Brain Vision EEG system, and repeating both tasks two days later while using
the 14-electrode Epoc EEG system. In the first task,
subjects observed a series of selected images from the International Affective
Picture System (IAPS). IAPS is a large standardized database of images, where
each image carries a rating based on its three dimensions of emotion: valence,
arousal, and control/dominance [6]. Emotion-laden pictures that had
previously been categorized by the target parameters of valence and arousal
were used to designate the image as high or low arousal/valence, previously
shown to correlate with known EEG signatures [7,8]. Similar to
this research, a recent fMRI study has shown that the emotions evoked by these
images effectively separate the emotions into distinct arousal/valence
quadrants [9].
The calibration for these emotion-laden localizations occurred across
participants. We pre-selected 100 high arousal and 100 low arousal images (high
and low arousal determined by their rating in the database) as well as 100 high
valence and 100 low valence images for use in our study. We presented each
participant with a randomized selection of 100 images (25 high arousal, 25 low
arousal, 25 high valence, 25 low valence) on a
computer monitor while recording their electrophysiological activity via the
Brain Vision headset. The stimulus presentation program began with a central
cross fixation to help participants focus their gaze and reduce eye movements.
After 200 ms, the first image was presented for 4500 ms, followed by a 1300 ms
presentation of the cross fix preceding the second image. Participants were
specifically instructed to try to form an emotional connection with each
image/word presented and to remain as still as possible while viewing
images/words. Images filled a 48.3 cm (19") monitor with a 1024 x
768-pixel resolution. Letters were presented at a font size of 48 points and
presented in the center of the monitor.
In the second task, subjects observed a series of selected words from the Affective Norms for English Words (ANEW) database. ANEW is another standardized inventory of normative emotional ratings for a large number of words in the English language; it was developed to complement IAPS [10]. Previous research using the ANEW has plotted the normative ratings in 2-dimensional space and found the distribution effectively complements the IAPS using EEG [9]. We presented each participant with a selection of words from the ANEW database on a computer monitor while recording their electrophysiological activity (the same procedure as with the IAPS images, this time with words); one series of words with the Brain Vision headset, and another series with the Epoc headset.
2.3 Event-related band potentials and signal amplification
EEGs were recorded for each participant during the tasks. The Brain Vision EEG recordings were obtained from electrodes held in place by means of an elastic cap (Easy Cap, Brain Vision, Morrisville, NC, USA) adhering to the ten-twenty system of measurements [11] with 32 active low-noise pin-type Ag-AgCl electrodes (1 mm each) amplified (sampled up to 1000 Hz) and recorded reference-free. Standard external landmarks (i.e. the inion, the nasion, and left and right pre-auricular points) were the basis for the montage distribution with electrodes positioned as percentage distances from these landmark points (see Figure S1 in Online Supplementary Materials). All impedances were kept under 25 kOhms so that they provided an effective electrical signal with minimal noise. The Epoc recordings were collected as is with no additional materials or measurements other than the device itself.
EEG signals were amplified, and low pass filtered at 100 kHz via the actiCHamp active channel amplifier with a sampling rate of 1000 Hz. All electrodes were offline re-referenced to a common average reference (i.e. the average was subtracted from each electrode for each time point). Offline averaging was performed such that event-related frequency band potentials (ERBP) were averaged separately for each stimulus type and condition for each electrode with an Epoch of -200 ms pre-stimulus to 1000 ms post-stimulus. ERBPs included the individual trials to code high and low arousal, high and low valence. For details and analysis outputs, please see Online Supplementary Material.
2.4 Statistical analysis
For our statistical analysis, it was necessary to evaluate whole brain ERBP because the precision of the electrode placement in the Epoc could not be confirmed. Hence, there is no validity without this and comparing electrodes of one system with the other is fruitless. Additionally, we used a Vincentization technique for the EEG data which involves the averaging of three or more subjects' quantile functions in order to obtain group quantiles [12-14]. This statistical technique allowed us to construct F values to evaluate differences between the five frequency bands adopting a by-item approach, where the electrodes are the unit of analysis (cases).
2.5 Ethics statement
Upon review of the submission materials, following Article 2.1 the Tri-Council Policy Statement Carleton University Research Ethics Board determined that this study did not require prior review or approval by the Board. Documentation and signed consent were waived. Documentation of consent was obtained by recording computerized log-ins during voluntary participation.
3. RESULTS
3.1Distinguishing electrophysiological states of arousal and valence with the IAPS Task
The two panels below (Figure 1) summarize the frequency band analysis for examining arousal and valence using the IAPS task. Figure 1A displays the distinguishing of high and low arousal states using the Brain Vision system and Epoc system. A two-way analysis of variance revealed that the observed differences in the arousal condition (high arousal vs. low arousal) was not statistically significant for either system; differences in frequency band (Delta, Theta, Alpha, Beta, Gamma) were significant for the Brain Vision system only (F (1,31) = 63.224, p < 0.01); and the interaction between arousal condition and frequency was also significant for Brain Vision only (F (1,31) = 12.303, p < 0.01). Figure 1B displays the comparison between high and low valence states using the Brain Vision system and the distinguishing of high and low valence states using the Epoc system. A two-way analysis of variance revealed that the observed differences in the valence condition (high valence vs. low valence) was statistically significant for the Brain Vision system only (F (1,31) =19.157, p < 0.01,); differences in frequency band (Delta, Theta, Alpha, Beta, Gamma) were significant for Brain Vision only (F (1,31) = 72.550, p < 0.01); and the interaction between valence condition and frequency was also significant for Brain Vision (F (1,31) = 51.138, p < 0.01).
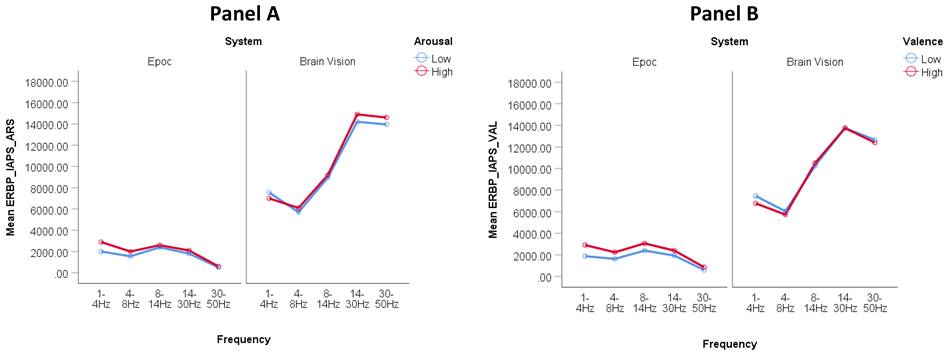
Figure 1. Distinguishing high and low arousal (Panel A) and valence (Panel B) between Epoc versus Brain Vision using event-related frequency band potentials (ERBP) with the IAPS task. Y-axis values are in squared microvolts (EEG Power). From left to right, EEG bands in x-axis correspond to standard nomenclature: delta, theta, alpha, beta and gamma.
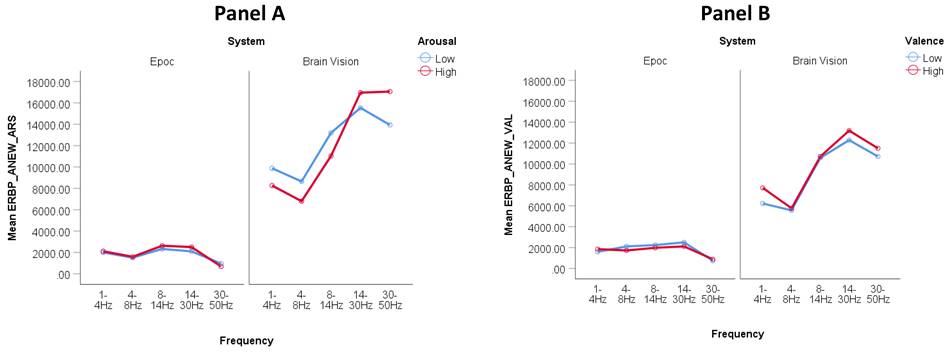
Figure 2. Distinguishing high and low arousal (Panel A) and valence (Panel B) between Epoc versus Brain Vision using event-related frequency band potentials (ERBP) with the ANEW task. Y-axis values are in squared microvolts (EEG Power). From left to right, EEG bands in x-axis correspond to standard nomenclature: delta, theta, alpha, beta and gamma.
3.2 Distinguishing electrophysiological states of arousal and valence with the ANEW task
The two panels below (Figure 2) summarize the frequency band analysis for examining arousal and valence using the ANEW task. We plotted the meansof the frequency band amplitude, measured in microvolts (µV) averaged across participants and electrodes. Figure 2A displays the comparison between high and low arousal states using the Brain Vision system and the Epoc system. A two-way analysis of variance revealed that the observed differences in the arousal condition (high arousal vs. low arousal) was not statistically significant for the Brain Vision system (F (1,31) = 0.085; p = 0.772) nor the Epoc system (F (1,13) = 7.185, p = 0.019); differences in frequency band (Delta, Theta, Alpha, Beta, Gamma) were significant for the Brain Vision system only (F (1,31) = 34.156, p < 0.01); and the interaction between arousal condition and frequency was significant for the Brain Vision system (F (1,31) = 53.339, p < 0.01) but not the Epoc system (F (1,13) = 2.191, p = 1.54). Figure 2B displays the high and low valence states using the Brain Vision and Emotiv system. A two-way analysis of variance revealed that the observed differences in condition (high valence vs. low valence) was not statistically significant for either system; differences in frequency band (Delta, Theta, Alpha, Beta, Gamma) were significant for the Brain Vision system only (F (1,31) = 26.690, p < 0.01); and the interaction between valence condition and frequency was significant for the Brain Vision system only (F (1,31) = 40.048, p < 0.01).
3.3 Alerting correlations of Epoc and BV
Correlational
data (Table 1 & 2) below provided some alerting trends among the different
systems and tasks. Here we used the approach outlined by Rosnow,
Rosenthal, and Rubin (2000) which describes the use of leveraging aggregate
correlations of group means rather than individual scores for identifying
overall trends and assessing validity [15].
Using this alerting correlation method, we identified trends among ERBP
and the different task conditions. In both Table 1 and Table 2 it can be noted
that the Epoc ERBP has a very poor and often inverse
relationship to that of the BV which questions the validity of the Epoc.
Table 1. Alerting Pearson
Correlations of ERBP for each condition and EEG system (Brain Vision, BV, vs. Epoc Emotiv) using the IAPS Task.
|
|
EEG Frequency |
Epoc Low Arousal |
Epoc High Arousal |
BV Low Arousal |
BV High Arousal |
Epoc Low Valence |
Epoc High Valence |
BV Low Valence |
BV High Valence |
|
|
EEG Frequency |
|
1 |
||||||||
|
|
||||||||||
|
Epoc Low Arousal |
|
-.887* |
1 |
|||||||
|
(0.045) |
||||||||||
|
Epoc High Arousal |
|
-.930* |
.946* |
1 |
||||||
|
|
(0.022) |
(0.015) |
||||||||
|
BV Low Arousal |
|
0.658 |
-0.468 |
-0.586 |
1 |
|||||
|
(0.227) |
(0.427) |
(0.299) |
||||||||
|
BV High Arousal |
|
0.666 |
-0.489 |
-0.624 |
.995** |
1 |
||||
|
|
(0.219) |
(0.403) |
(0.260) |
(0.000) |
||||||
|
Epoc Low Valence |
|
-.881* |
.992** |
.908* |
-0.412 |
-0.423 |
1 |
|||
|
(0.048) |
(0.001) |
(0.033) |
(0.491) |
(0.478) |
||||||
|
Epoc High Valence |
|
-.923* |
.989** |
.983** |
-0.548 |
-0.575 |
.967** |
1 |
||
|
|
(0.025) |
(0.001) |
(0.003) |
(0.339) |
(0.310) |
(0.007) |
||||
|
BV Low Valence |
|
0.553 |
-0.297 |
-0.471 |
.975** |
.974** |
-0.231 |
-0.400 |
1 |
|
|
(0.334) |
(0.627) |
(0.423) |
(0.005) |
(0.005) |
(0.708) |
(0.505) |
||||
|
BV High Valence |
0.523 |
-0.252 |
-0.449 |
.954* |
.958* |
-0.180 |
-0.364 |
.996** |
1 |
|
|
(0.366) |
(0.683) |
(0.448) |
(0.012) |
(0.010) |
(0.772) |
(0.548) |
(0.000) |
|||
|
*. Correlation is significant at the 0.05 level (2-tailed). |
||||||||||
**. Correlation is significant at the 0.01 level (2-tailed).
1 Exact P-Values for correlations are in parentheses.
Table 2. Alerting Pearson
Correlations of ERBP for each condition and EEG system (Brain Vision, BV, vs. Epoc Emotiv) using the ANEW task.
|
|
EEG Frequency |
Epoc Low Arousal |
Epoc High Arousal |
BV Low Arousal |
BV High Arousal |
Epoc Low Valence |
Epoc High Valence |
BV Low Valence |
BV High Valence |
|
|
EEG Frequency |
1 |
|||||||||
|
Epoc Low Arousal |
-0.799 |
1 |
||||||||
|
(0.105) |
||||||||||
|
Epoc High Arousal |
-0.809 |
.992** |
1 |
|||||||
|
(0.098) |
(0.001) |
|||||||||
|
BV Low Arousal |
0.444 |
0.099 |
0.134 |
1 |
||||||
|
(0.454) |
(0.874) |
(0.830) |
||||||||
|
BV High Arousal |
0.682 |
-0.241 |
-0.202 |
.932* |
1 |
|||||
|
(0.205) |
(0.696) |
(0.745) |
(0.021) |
|||||||
|
Epoc Low Valence |
-0.811 |
0.790 |
0.856 |
0.040 |
-0.234 |
1 |
||||
|
(0.096) |
(0.112) |
(0.064) |
(0.949) |
(0.704) |
||||||
|
Epoc High Valence |
-.912* |
.928* |
.958* |
-0.037 |
-0.329 |
.926* |
1 |
|||
|
(0.031) |
(0.023) |
(0.010) |
(0.953) |
(0.589) |
(0.024) |
|||||
|
BV Low Valence |
0.424 |
0.124 |
0.159 |
.992** |
.901* |
0.083 |
-0.020 |
1 |
||
|
(0.477) |
(0.842) |
(0.798) |
(0.001) |
(0.037) |
(0.894) |
(0.975) |
||||
|
BV High Valence |
0.431 |
0.124 |
0.152 |
.997** |
.928* |
0.021 |
-0.025 |
.982** |
1 |
|
|
(0.469) |
(0.843) |
(0.807) |
(0.000) |
(0.023) |
(0.973) |
(0.968) |
(0.003) |
|||
|
*. Correlation is significant at the 0.05 level (2-tailed). |
||||||||||
|
**. Correlation is significant at the 0.01 level (2-tailed). 1 Exact P-Values for correlations are in parentheses. |
||||||||||
4.
DISCUSSION & CONCLUSIONS
The results of this
preliminary study suggest that the wireless 14-electrode Epoc
system can be used to show small differences in general electrical activity
between psychophysiological states of high and low arousal, and high and low
valence (particularly in the delta, theta, and alpha frequency ranges). The
observed differences, however, are not statistically significant such as with
the stationary Brain Vision device. Therefore, the use of the Epoc device lacks the degree of fidelity that is required
to properly distinguish these states within a personalized design which would
be very undesirable in a research setting. The findings offer evidence against
the validity of consumer-grade systems for research grade tasks, although their
low fidelity ability to distinguish states may still be useful for some
EEG-based BCI applications. The Epoc, and similar
consumer-grade devices with a limited number of electrodes could be strongly
improved simply by designing a product which adheres to conventional EEG electrode
placement. Using the common electrode placements would lead to improved
comparative capabilities with traditional EEG devices/existing EEG studies,
better-referencing montages, and increased translatability of anatomically
related conclusions.
During the ANEW and IAPS tasks
whereas the Brain Vision system detected high levels of gamma frequency band
activity, the Epoc system consistently failed to
replicate this finding. We hypothesize that this difference can be attributed
to technical aspects of the 14-electrode setup such as the lack of a signal
amplifier. The Brain Vision system uses an ActiChampTM
signal amplifier which enables it to detect higher frequencies of
electrophysiological activity-higher beta oscillations and gamma oscillations.
In contrast, the Epoc wireless headset transmits
electrophysiological recordings directly from the scalp to a USB-A dongle in
the signal processing computer. This interface for amplifying signals may be in
part responsible for making higher beta and gamma oscillations harder to
detect. A more sophisticated amplification would drastically improve the signal
quality of consumer devices, but the cost required to do so would not be
consumer friendly.
For the ANEW task, differences
in frequency band amplitude between high and low valence states were not
significant, whereas the interaction between
valence condition and frequency was significant. This discrepancy is likely due
to the close proximity of the emotion-evoking ratings
in the high valence and low valence conditions. Future studies should examine
this result using a greater difference between the mean rating of the words
used in the two conditions of the ANEW task.
In
conclusion, we demonstrate further evidence for a consumer EEGs' inability to
reproduce differences that are distinctly obtainable using a research EEG
device [16]. We were able to
demonstrate this with a small number of subjects by using the statistical
technique of Vincentization. Given that the goal of
most emerging approaches using EEG-based machine learning and categorization
algorithms is ultimately intended for personalized individual consumer use, the
fact that the present perspective focused on a demonstration based on a small
sample size cannot be considered as a major limitation. The experiment was done
at the same grade (scale) as that of the intended consumer usage: in other
words, it focusses on usability in one person, not groups of people.
Overall, we
urge caution to researchers planning to use a consumer device for important
research experiments but do acknowledge that devices like the Emotiv have some benefits such as being wireless, quick to
set up, are extremely portable, and could still be useful in some BCI
applications where signal quality and validity are not paramount. For instance,
exerting BCI control over an external device (i.e. wheelchair, prosthetic arm)
can be done by calibrating any signal to a function of the device (i.e. move
forward, backward, side to side, extend/retract reach).
Notice, in
this example the ability for the BCI to differentiate valence/arousal emotional
states is not necessary. In this case, the goal is to make the system
successfully work for the user, not to produce valid signatures of emotion. On
the other hand, if the goal of a study has anything to do with emotional
states, like using an Epoc to investigate clinical
neuropsychiatric populations for emotional dysregulation in mood disorders or
any cognitive neuroscience experiment of emotion in which you need to be
confident in the validity of your signal, the consumer-grade devices must be
cautioned against. Therefore, we argue that the issue is not so much that
consumer devices have no place in the research laboratory, but rather that
their use and data interpretation need to be done appropriately in contexts in
which they are valid. Upon this investigation, using an Epoc
EEG device to determine emotional states in individuals would have questionable
validity as it is not reproducible using research grade EEG. The validity
should not be assumed as simply coming in a box, together with the device!
Supplementary Materials: Additional information regarding the EEG signal processing are available online at https://doi.org/10.31117/neuroscirn.v2n1.21.
Acknowledgements: This work was funded by a NSERC/DND partnership grant (Natural Sciences and Engineering Research Council and Department of National Defense of Canada) awarded to AD. No funds were received for covering the costs to publish in open access.
Author Contributions: DMB and JG contributed equally to this paper and were responsible for performing analysis of data and the writing of the paper. AD conceived, designed, and oversaw the experiments, and revised and edited the paper. JG and other assistants performed the experiment.
Conflicts of Interest: The authors declare no conflict of interest.
References
1.
Lin Y-P, Wang C-H, Jung T-P,
Wu T-L, Jeng S-K, Duann
J-R, et al. EEG-based emotion recognition in music listening. IEEE Trans
Biomed Eng. 2010;57(7):1798-1806. https://doi.org/10.1109/TBME.2010.2048568
2.
Ross W, Morris A, Ulieru M, Guyard AB. RECON: An
Adaptive Human-Machine System for Supporting Intelligence Analysis. Nat
Genet. 2013;45(10):1109. https://doi.org/10.1109/smc.2013.138
3.
Maskeliunas R, Damasevicius
R, Martisius I, Vasiljevas
M. Consumer-grade EEG devices: are they usable for control tasks? PeerJ. 2016;4:e1746. https://doi.org/10.7717/peerj.1746
4.
Duvinage M, Castermans
T, Petieau M, Hoellinger T,
Cheron G, Dutoit T.
Performance of the Emotiv Epoc
headset for P300-based applications. Biomed Eng
Online. 2013;12:56. https://doi.org/10.1186/1475-925X-12-56
5.
Messer SC, Angold A, Costello EJ. Development of a short questionnaire
for use in epidemiological studies of depression in children and adolescents:
Factor composition and structure across development. Int J Methods Psychiatr Res, 1995;5:251-262.
6.
Lang PJ, Bradley MM, Cuthbert
BN. International affective picture system (IAPS): Technical manual and
affective ratings. Psychology. 1997;77.
7.
Lang PJ, Greenwald MK,
Bradley MM, Hamm AO. Looking at pictures: affective, facial, visceral, and
behavioral reactions. Psychophysiology. 1993;30(3):261-273. https://doi.org/10.1111/j.1469-8986.1993.tb03352.x
8.
Scott GG, O'Donnell PJ,
Leuthold H, Sereno SC. Early emotion word processing: evidence from
event-related potentials. Biol Psychol. 2008;80(1):95-104. https://doi.org/10.1016/j.biopsycho.2008.03.010
9.
Kassam KS, Markey AR, Cherkassky VL, Loewenstein G, Just MA. Identifying Emotions
on the Basis of Neural Activation. PLoS
ONE. 2013;8(6):e66032. https://doi.org/10.1371/journal.pone.0066032
10.
Bradley MM, Lang PJ.
Affective norms for English words (ANEW): Instruction manual and affective
ratings. Technical Report C-1, The Center for Research in Psychophysiology. University
of Florida. 1999.
11.
Jurcak V, Tsuzuki D, Dan I. 10/20, 10/10, and
10/5 systems revisited: their validity as relative head-surface-based
positioning systems. Neuroimage. 2007;34(4):1600-1611. https://doi.org/10.1016/j.neuroimage.2006.09.024
12.
Hilgard, ER (1951). Methods
and procedures in the study of learning. In Stevens, SS (Ed.) Handbook of
experimental psychology. New York, Wiley, p.517-567.
13.
Genest C. Vincentization
Revisited. The Annals of Statistics. 1992;20(2):1137. https://doi.org/10.1214/aos/1176348676
14.
Vincent SB. The functions of
the vibrissae in the behavior of the white rat. Behavior Monographs.
University of Chicago. 1912;5(1).
15.
Rosnow RL, Rosenthal R, Rubin DB. Contrasts and
correlations in effect-size estimation. Psychol Sci. 2001;11(6):446-453.
https://doi.org/10.1111/1467-9280.00287
16.
Nijboer F, van de Laar
B, Gerritsen S, Nijholt A, Poel M. Usability of Three
Electroencephalogram Headsets for Brain-Computer Interfaces: A Within Subject
Comparison. Interact Comput. 2015;27(5):500. https://doi.org/10.1093/iwc/iwv023